Method · 06
Touchpoint mapping that respects real paths
Buyers do not walk a single funnel. potsim maps the nodes where stories about tools like QuickBooks are formed, challenged, or abandoned.
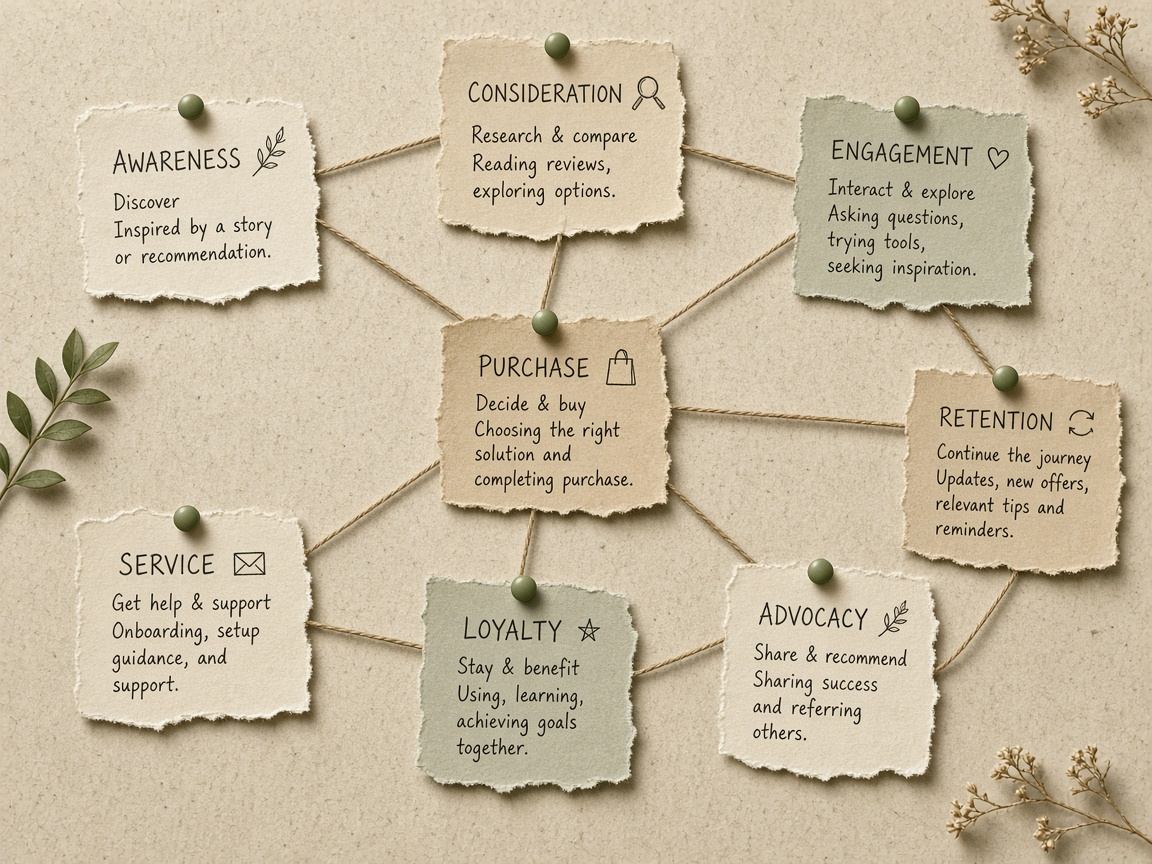
Build the map from evidence
Start with chronology from interviews: first symptom, first search, first advisor conversation, first demo, first internal pitch, first stall. Place each moment as a node. Annotate who was present using decision-maker cards.
Enrich nodes with artifacts from market observation. If a webinar repeatedly precedes shortlist conversations, it earns a permanent pin. If QuickBooks comparison charts appear in three journeys, mark that content class as a category landmark — not as endorsement theater.
Node attributes
- Emotion tone (calm, rushed, embarrassed)
- Evidence demanded
- Friction tags linked to pattern cards
- Owner inside your company who can improve it
Timeline of a typical US SMB evaluation
Symptom: Month-end takes too long; spreadsheets proliferate.
Advisor ping: CPA mentions QuickBooks or peers; trust transfers.
Content skim: Pricing and migration posts shape expectations.
Demo: Champions watch features; blockers listen for risk language.
Stall: Friction patterns surface — see friction patterns.
Re-narrative: Positioning claims must meet the stall where it lives.